3 Charts That Show How the Crypto Bull Market Is Just Getting Started
Finally, after two long years, things are picking back up in the crypto world. Since the beginning of the year, the total crypto market has grown by 35%, just 20% off from eclipsing its all-time high of $2.8 trillion in late 2021.
With such a significant jump, it’s reasonable to worry that crypto’s momentum may sputter, making an investment today too risky. However, when looking at the data, it appears crypto’s bull market has yet to hit a local peak.
In other words, while some gains may be behind us, there’s still plenty of potential in the crypto market. Let’s look at three charts showing how crypto’s best days remain ahead.
Breaking down Bitcoin
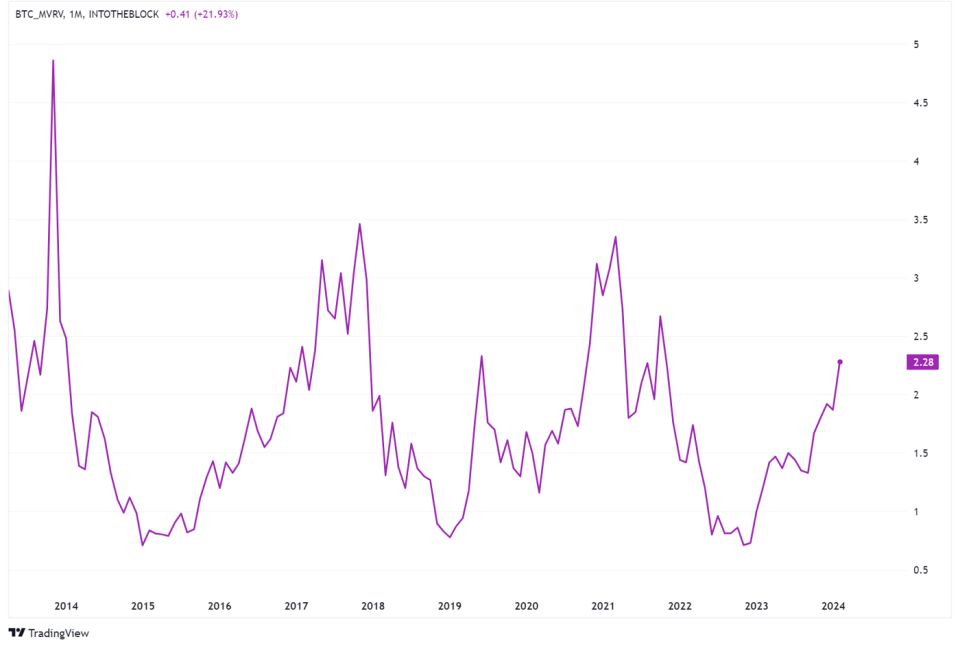
Since it makes up around half of the value in crypto, evaluating Bitcoin‘s (CRYPTO: BTC) current position can provide context on the market’s overall position. This is a chart of Bitcoin’s Market Value to Realized Value, better known as MVRV. Developed by analysts David Puell and Murad Muhmudov, MVRV divides Bitcoin’s market value by its realized value.

Data by TradingView
Market value is calculated by multiplying Bitcoin’s circulating supply by its current price. It is the same as the market capitalization. On the other hand, realized value is calculated by determining the price of each Bitcoin the last time it was involved in a transaction. This can provide a more granular insight into market dynamics, as it removes the generalization that every Bitcoin in circulation was purchased at the most recent price.
By dividing the two, we get the MVRV value and a better glimpse into Bitcoin’s current position. In fact, MVRV has historically proven to be a timely indicator of when the crypto market as a whole has topped or bottomed. With its current value at just 2.3, Bitcoin is far from levels of around 3.5 when bull markets tend to start losing steam.
Analyzing Coinbase trading volume
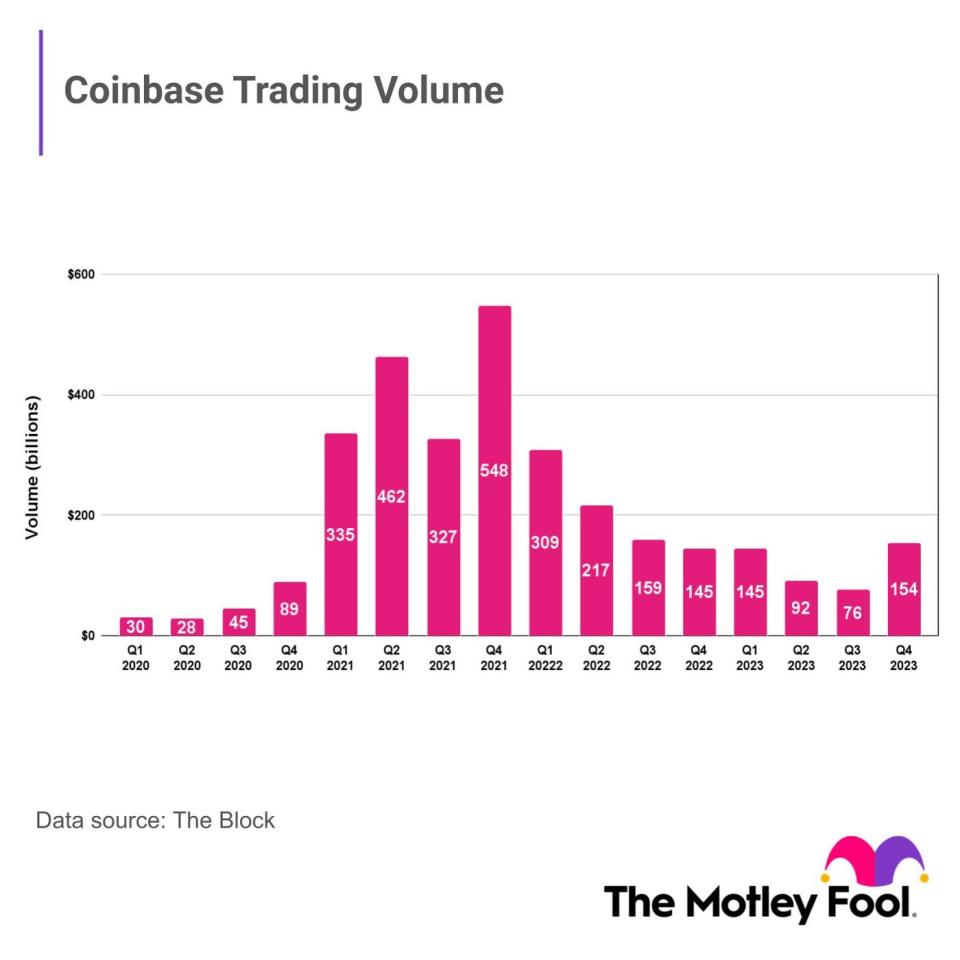
As one of the most popular crypto platforms in the world, we can extrapolate trading data from Coinbase Global (NASDAQ: COIN) to better understand the state of affairs in crypto. Similar to Bitcoin’s MVRV, trading volume on Coinbase shows there is still room for the crypto market to grow.
Based on the graph, it’s abundantly clear that investors have yet to make their way back to crypto. We can see that during the last bull market of 2021, trading volume on the platform surpassed more than $548 billion in Q4 alone. As of the most recent earnings report, total trading volume sits at just $154 billion, levels last seen when crypto was in the middle of a brutal crypto winter.

Until these numbers get closer to that of the last bull market, there’s little reason to believe crypto’s recent surge is just scratching the surface. Even then, since crypto has historically notched new all-time highs with each bull-market cycle, don’t be surprised if the total volume in this cycle outdoes previous records.
Checking in on DeFi
Still in its beginning stages, decentralized finance (DeFi) is one of the most prominent use cases of cryptocurrencies and blockchain technology. Composed of non-fungible tokens (NFTs), stablecoins, lending protocols, and much more, the DeFi economy is brimming with innovative applications pushing the boundaries of finance.
There are several blockchains that make up DeFi. As of today, Ethereum (CRYPTO: ETH) dominates the space, but dozens of others are vying for market share.
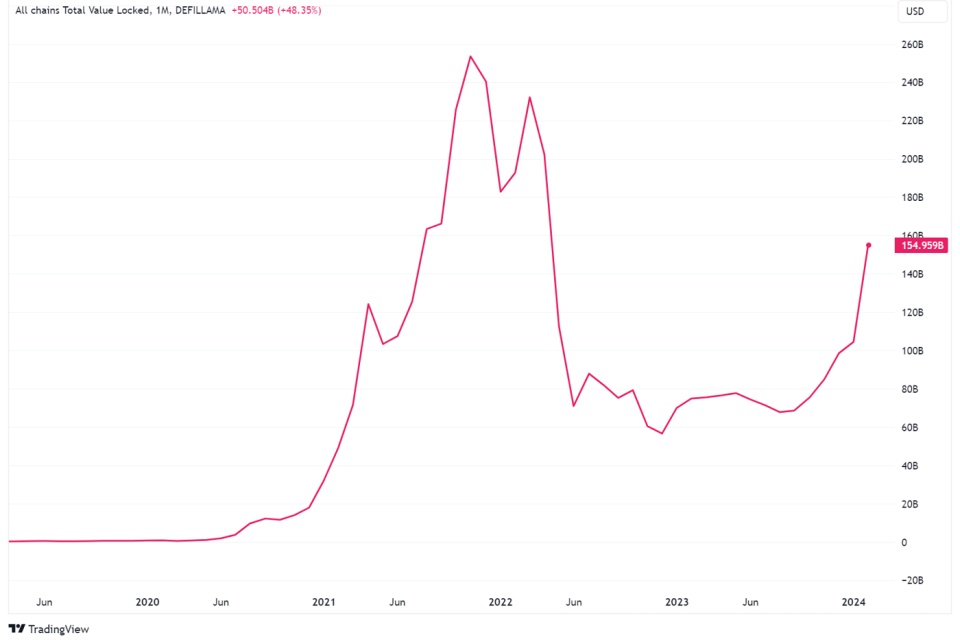
With so many blockchains contributing to the DeFi economy, tracking its value can be a meaningful proxy to measure the crypto market’s progress and position. Currently in an uptrend due to the recent resurgence, the collective value of DeFi currencies is around $85 billion today.

Data by TradingView
Yet, this is still considerably off of its all-time high hit during the last bull run that peaked in November 2021. At the time, DeFi amassed a whopping value of more than $175 billion.
In a similar vein to trading volumes, it is safe to assume that due to DeFi’s burgeoning potential, it should surpass previous records. Should this prove to be the case, then there is plenty of catching up to do before we can even begin to consider crypto’s bull market to have peaked.
Should you invest $1,000 in Bitcoin right now?
Before you buy stock in Bitcoin, consider this:
The Motley Fool Stock Advisor analyst team just identified what they believe are the 10 best stocks for investors to buy now… and Bitcoin wasn’t one of them. The 10 stocks that made the cut could produce monster returns in the coming years.
Stock Advisor provides investors with an easy-to-follow blueprint for success, including guidance on building a portfolio, regular updates from analysts, and two new stock picks each month. The Stock Advisor service has more than tripled the return of S&P 500 since 2002*.
*Stock Advisor returns as of February 26, 2024
RJ Fulton has positions in Bitcoin, Coinbase Global, and Ethereum. The Motley Fool has positions in and recommends Bitcoin, Coinbase Global, and Ethereum. The Motley Fool has a disclosure policy.
3 Charts That Show How the Crypto Bull Market Is Just Getting Started was originally published by The Motley Fool

